Formulas that reference a table are easier to read and write when using the table name instead of a generic range address like A2:A10.Easily add table styles to your data. These styles (and any formats) are automatically applied to new data (rows or columns) added to the table.When you add data to the table formula references automatically update to include this data.Each table has it’s own set of filter and sort toggles.Column headings and filters automatically stay in view when scrolling down long lists of data.Entire columns are easy to select by clicking on the top of the column heading.Charts that reference a table will automatically update when you add/change data in your table.You can add summary statistics like sums, averages and counts to your table.
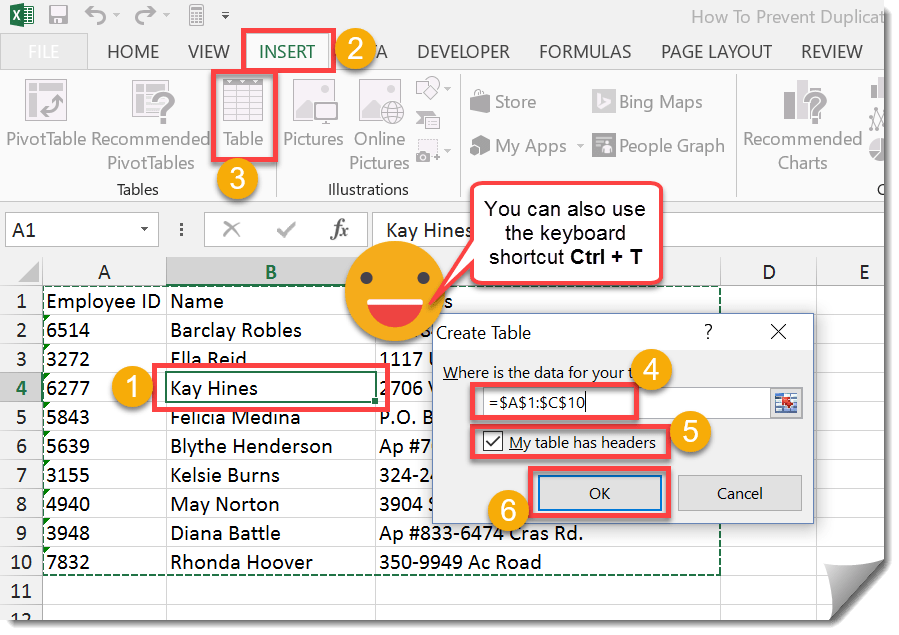
Part 1: How to turn your data into a table
Turn your data into a table. You can also insert a table using the Ctrl + T keyboard shortcut.
Part 2: Name and style your table
Now that your data has been turned into a table you’ll want to change the default name it’s been given (usually something like Table1) to make it easier to remember when reading and writing formulas that reference the data.
Part 3: Adding summary statistics to your table
You can easily add summary statistics such as sums, counts and averages to the bottom of your table.
Part 4: Sorting and filtering your table
You can also easily sort and filter the data in your table.